Kepler’s Laws
The purpose of this lab was to examine and verify all three of Kepler’s Laws using the computer planetarium program Distant Suns to collect data on the orbits of several planets, moons, and a comet.
2.1 & 2.2 Data for Collecting Planetary Data: Mercury and Mars

2.3 and 2.4 Calculating Kepler’s Constant
In this section we will calculate Kepler’s Constant using the twelve values of solar distances for Mercury and Mars’ orbits (chart a). Then We will calculate Kepler’s Constant the correct way using the value of the semi major axis, or taking the mean of the largest and smallest values for each Planet’s Solar Distance (chart b).
Example in Calculations:

Example in Calculations:
Chart B)

2.5 Cometary Motion

Example in Calculations:
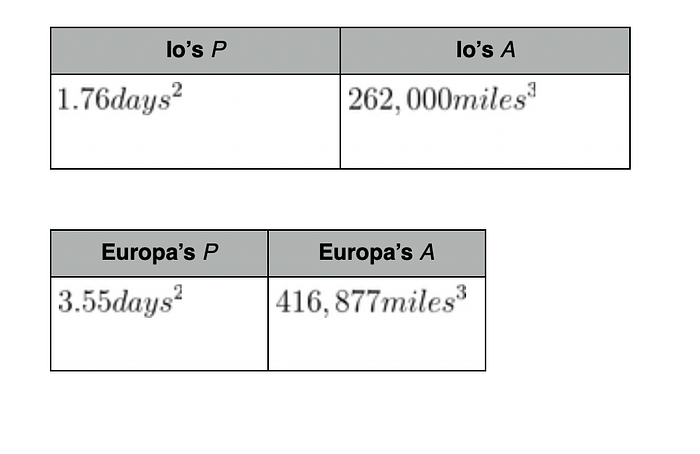
2.6.1 Measuring Kepler’s Constant for Jupiter’s Moons

Io Start Time: January 22 12 a.m.
I0 End Time: January 23 4 p.m.
Orbital period: 1.76 days
Europa Start Time: January 22 12 a.m.
Europa End Time: January 25 2p.m.
Orbital period: 3.55 days
2.7 Lab Write-up Questions
1.
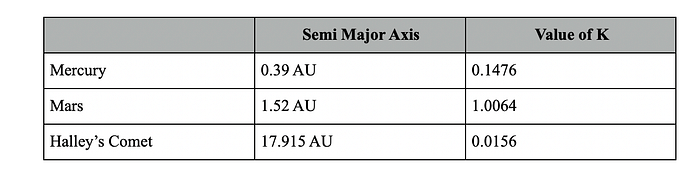
Mean of K = (0.1476 + 1.0064 + 0.0156)/3 = 0.3898
2.
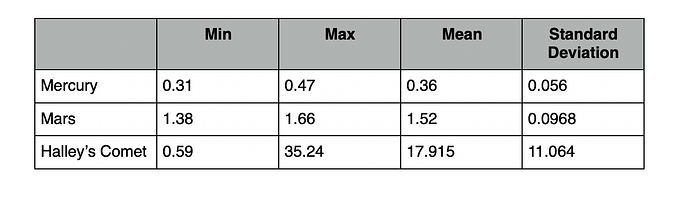
Mercury has the smallest standard deviation and Halley’s Comet has the largest standard deviation. Standard deviation gives an idea of how close the entire set of data is to the average value. Data sets with a small standard deviation have tightly grouped, precise data. Data sets with large standard deviations have data spread out over a wide range of values. This means that data used with the semi-major axis will be more precise since the data will be closer together.
- It would be 3,479,151,092 seconds/ 3.291*10 ^13 meters
Radar Measurement of Mercury’s Rotation
Using the CLEA computer program, the purpose of this lab is to determine the speed of astronomical objects like the planet Mercury.
6.1: The Doppler Effect
The Doppler Effect is a phenomenon tested by Christian Doppler, an Austrian physicist, who measured the change in frequencies based on their relative moving positions. We can use this method to determine the speeds of astronomical objects by finding the change in frequency, the speed of light source relative to the observer and multiplying them by the speed of light.
6.2: The Doppler Shift and Planetary Motion
We can determine a planet’s rate of rotation by measuring how fast the planet is moving with respect to the Earth via frequency changes of echos on the sub-radar point and then using geometry to figure out rotational velocity of a planet’s axis.
6.3: Measuring Mercury’s Rotation Rate
The goal of this lab is to determine the rotational period of Mercury; a particularly interesting planet because its spin period is not equal to its orbital period as scientists predicted due to its close proximity to the sun.
6.4: Using the CLEA Radio Telescope
We will simulate the process of sending a radar pulse of known frequency toward the planet Mercury using the CLEA Radio Telescope computer program. By taking time slices, we can determine which areas of Mercury’s surface produced the echoes in order to determine how Mercury is moving.
6.4.1 Overall Experimental Strategy
- Turn on Radio Telescope
- Calculate position of Mercury and slew the telescope to it
- Send pulse of 430 Megahertz
- While waiting for echo of pulse, calculate geometrical parameters for the echos at 120, 210, 300 and 390 microseconds after the arrival of the sub-radar pulse.
- Measure the highest and lowest frequency shift of the returning echoes from the four delayed echoes
- Record data and use them to calculate rotational velocity of Mercury’s equator from each of the four delayed echos
- Calculate Mercury’s rotational period in days
6.5: Procedure
Procedural explanations for computer program meant to simulate a real astronomy data-taking session; imitates the operation of a large radio telescope used to determine the rate of rotation of a planet by Doppler radar. The procedure includes activating sidereal drive to track planets as Earth moves, calculating the position of Mercury in order to record the distance from Earth and the expected time for the pulse to return, and sending out pulses to Mercury.
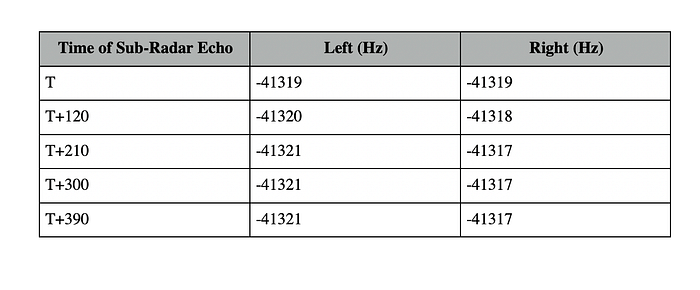
6.5.1 Taking Data
Look at the data window for the sub-radar echo and record the location of the peak in order to figure out how fast Mercury is moving in its orbit, relative to Earth. For all other delayed echoes, measure the positions of the left and right “shoulders” of the plots. They represent echoes from the parts of the planet that are turning towards you and away from you the fastest. Measure the left and right shoulders. Write down all of the results of these measurements.